
 |
August 2012 |  |
||||
|---|---|---|---|---|---|---|
| S | M | T | W | T | F | S |
| 1 | 2 | 3 | 4 | |||
| 5 | 6 | 7 | 8 | 9 | 10 | 11 |
| 12 | 13 | 14 | 15 | 16 | 17 | 18 |
| 19 | 20 | 21 | 22 | 23 | 24 | 25 |
| 26 | 27 | 28 | 29 | 30 | 31 | |
January 01 2009 to January 09 2018
Select year and month to jump to
GCOOS SST
Images for August 26, 2012
Cloud-masked Sea Surface Temperatures of the Gulf of MexicoSee the GCOOS research page for more information
Aug 26 2012 NOAA 7 Day Composite with SSH
Sea Surface Temperature average from August 19, 2012 to August 26, 2012 with Sea Surface Height contours from August 22, 2012
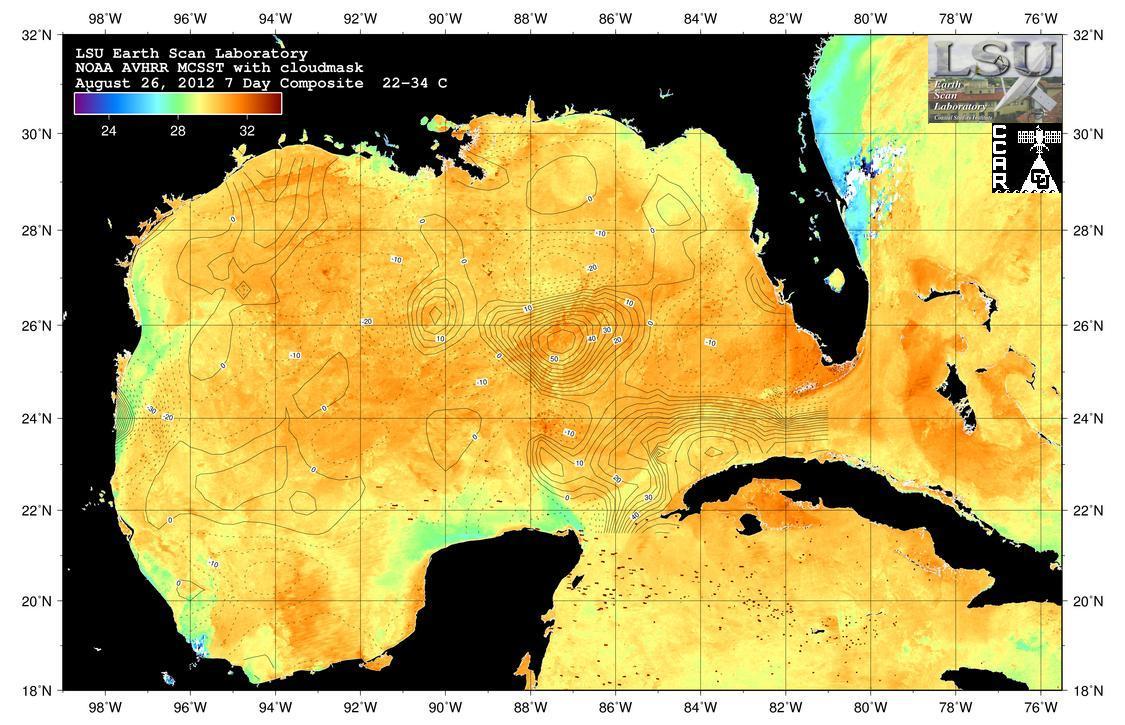
Sea Surface Temperature average from August 19, 2012 to August 26, 2012 with Sea Surface Height contours from August 22, 2012

