Bands 8, 9, and 10, from GOES-16, are combined to render the upper, mid, and lower level atmosphere in pseudo-color. Blue shades represent the higher elevations, and the reddish-browns, the lower.
GOES Ocean and Atmospheric Surveillance
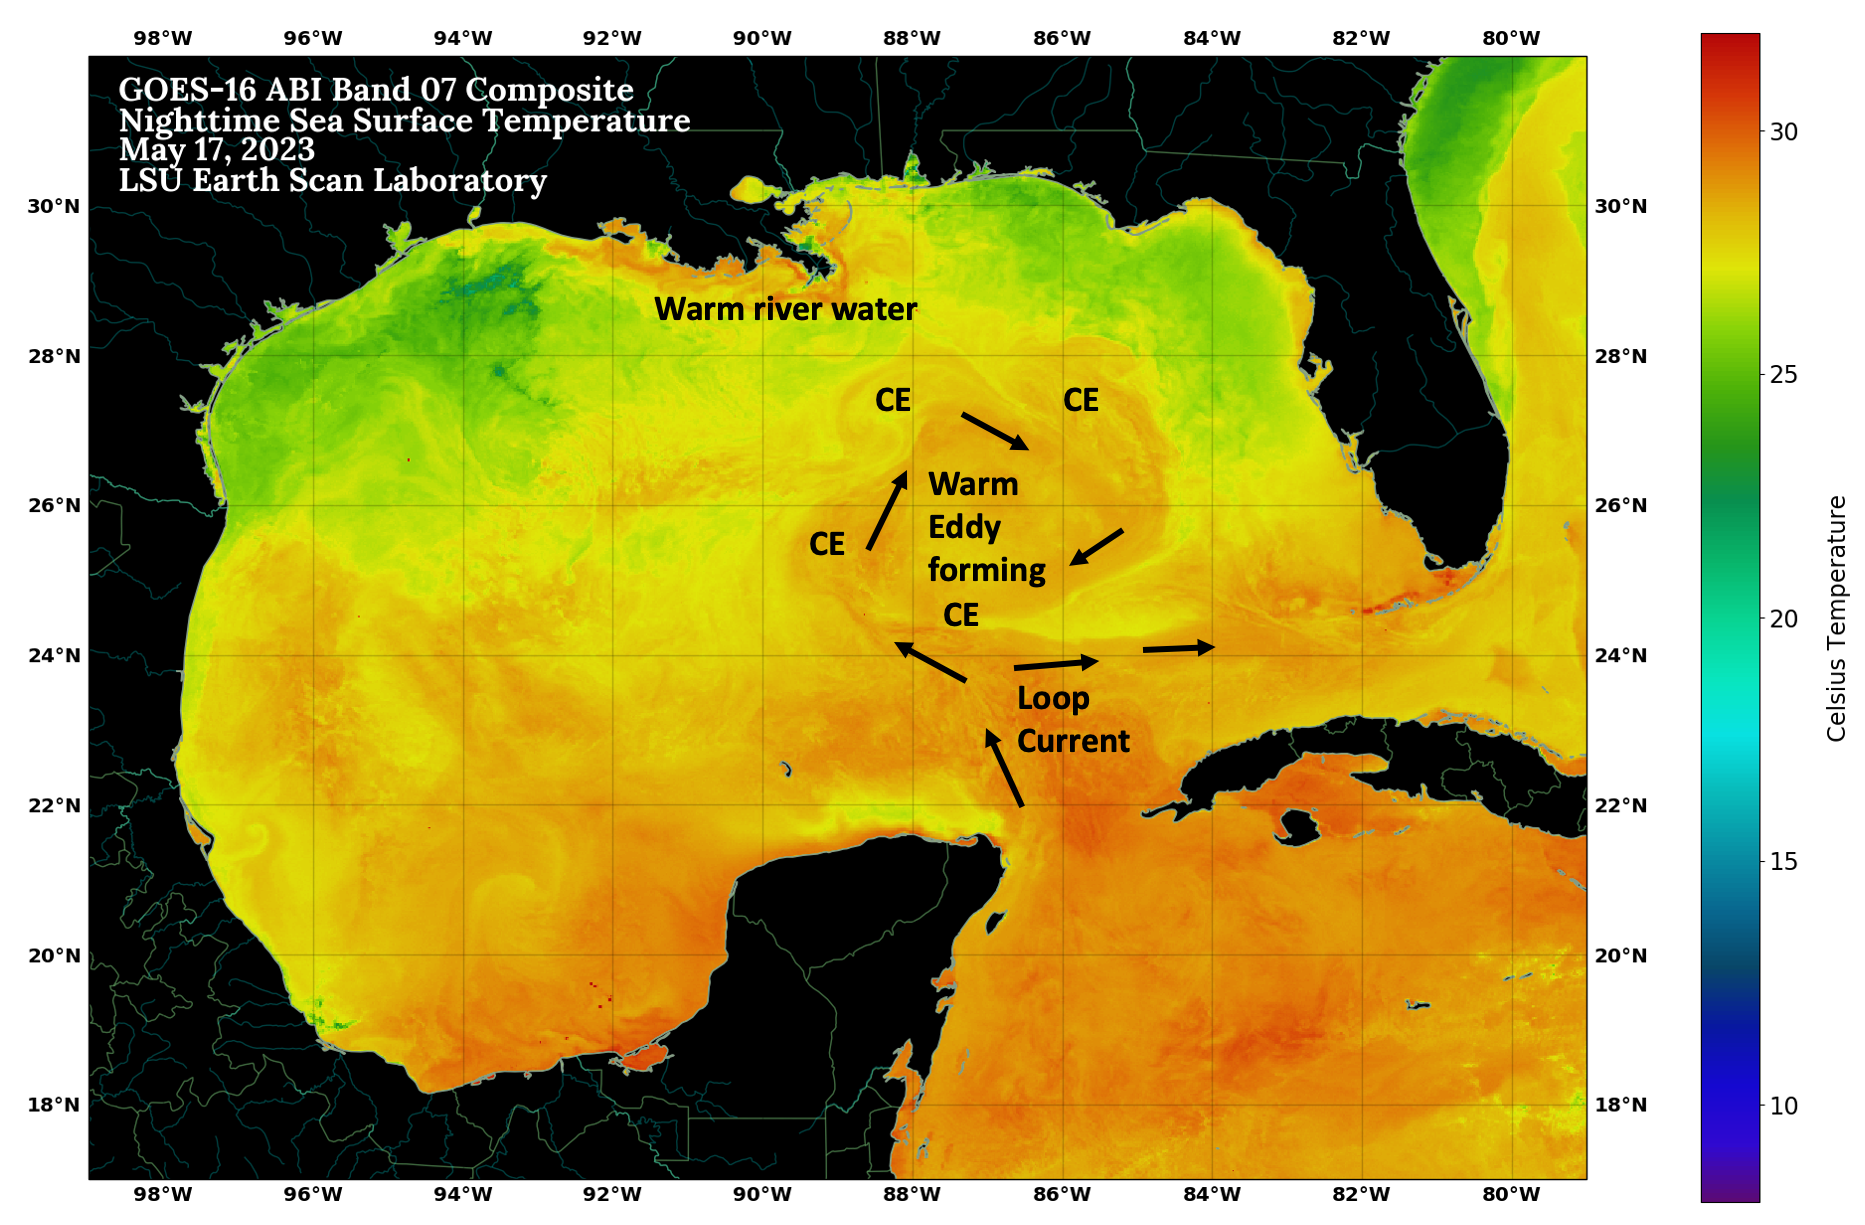
The animation at left marks the beginning of our utilization of the new generation of NOAA geostationary satellites. GOES-16 (east) delivers this "CONUS" view every five minutes, in 16 bands, as well as a "full disk" hemispheric view every 15 minutes. At right is a composite nighttime sea surface temperature from GOES-16 band 7. The link below the image leads to the daily archive. Please check back often for more new GOES-16 products!Image of The Week
Tropical Storm Alberto Causes Large-scale Gulf Cooling in mid-June 2024
Rapid Northward Surge of Loop Current in Central Gulf: June 2023
Satellite Sensors Highlight New Loop Current Eddy Detachment in January
The newest Gulf of Mexico Warm Core Eddy (WCE) named Eddy Zodiac detached from the Loop Current around 12/28/22. The animation of GOES composite sea surface temperature (SST) data (center) shows the detachment and subsequent surface circulation from eddy detachment to mid-January 2023. The left and right panels depict SST as well as contours of altimeter-derived SSH (sea surface height) on 12/29/22 and 1/13/22. The 17 cm SSH contour (bold line) highlights the outer margins of each warm water feature. The clockwise rotation within Eddy Zodiac is apparent in the SST animation. Loop Current frontal eddies are smaller cold-core eddies (rotating counter-clockwise) which can be seen along the northern margin of the Loop Current travelling eastward towards the Florida Straits. In addition, along the northern side of the WCE, rapid growth of a cold-core frontal eddy can be observed leading to a circulation that competes in size with the WCE. Cold-core eddies are characterized by the upwelling of nutrient-rich waters which support enormous phytoplankton blooms especially after a hurricane passes over, leading to the development of a prolific biological community, which includes tuna species and sperm whales.
The SSH contours were provided by Dr. Robert Leben, Colorado Center for Astrodynamics Research, University of Colorado, Boulder. The GOES SST imagery were provided by Mr. Alaric Haag and Dr. Nan Walker, affiliated with the Earth Scan Lab, Dept. of Oceanography and Coastal Sciences Coastal Studies Institute, Louisiana State University, Baton Rouge. Naming of Loop Current warm core eddies is performed routinely by Horizon Marine Inc.
More GOES ABI SST composite imagery can be viewed in our ABI Nightly Gulf of Mexico Composite SST imagery archive.
Heavy winter precipitation in the midwest brought rising waters to the Mississippi River in late February, 2018. Last opened just two years ago, the Bonnet Carre Spillway, located in the southwestern corner of Lake Pontchartrain, was opened on March 8th, to relieve pressure on the levees. Engineers sought to keep the river stage at New Orleans below 17 feet, and have opened about half of the 350 bays. This gallery of images will catalog the macro-scale movement of this sediment-laden water. More images can be found in the recent images in the Image of the Week collection.
The Mississippi River flood event of 2019 lasted from February to July, requiring two openings of the Bonnet Carre Spillway into Lake Pontchartrain. Click the abbreviated animation above to download a Quicktime animation of the relatively clear sky images during these six months to showcase sediment discharges from the Mississippi River birds-foot delta, the Atchafalaya delta, as well as from Lake Pontchartrain and other Louisiana estuaries.

Florida Keys

Texas Gulf Coast

Laguna de Términos
New Regional MODIS Truecolor areas
The Earth Scan Laboratory is excited to now provide high-resolution MODIS Truecolor imagery for several new areas around the entire perimeter of the Gulf of Mexico. The above images are examples of just a few of the new regional views. The new medium-scale scenes include the northwest, central, northeast Gulf coast, central Florida and the Keys, the Yucatán peninsula, Laguna de Términos, Mexico and Texas Gulf coast.Please visit the MODIS Regional Truecolor Imagery archive to browse the entire archive. We are busy back-filling dates for 2021 at this time.
Left panel: Hurricane Ida's track is shown (at left) overlaid on the August 26, 2021 Sea Surface Height (SSH) image*, with positions plotted every 12 hours to highlight the storm's rapid intensification. After leaving Cuba, Ida tracked over the Gulf’s warm high velocity current named the Loop Current (LC). This current exhibits elevated SSH compared with surrounding waters and shows up as dark orange in this image. The LC margin can be defined by the 17 cm contour, shown here with a solid black line. Blue image colors show areas of lowest heat content within cold core eddies, prevalent along the outer margin of the LC. Hurricane Ida was a category 1 hurricane on 8/28 (00h00 UTC) early in its transit of the LC, but 12 hours later she had increased to category 2, and another 12 hours later had attained category 4 status, which was sustained until landfall on the Louisiana coast. It is apparent that most of her intensity change occurred while traversing the core axis of the Loop Current. Ida, like several previous storms (Lili, Katrina, Rita, and others), exhibited rapid intensification over the Loop Current, which provides abundant heat to developing storms.
Right panel: Hurricane Ida is shown making landfall on Louisiana coast in a false color image of cloudtop temperature, using data from the ABI sensor onboard the GOES-16 geostationary satellite. Click the image to download a Quicktime animation showing the storm as it develops over the Caribbean, enters and rapidly intensifies in the Gulf of Mexico. A broader view of the entire life of Hurricane Ida is available here.
* Provided by Dr. Robert Leben, Colorado Center for Astrodynamics Research, Univ. Colorado.


