Best of the Earth Scan Laboratory

The Earth Scan Lab has produced a great deal of imagery and research from around the world. Select an item below to explore our best work.
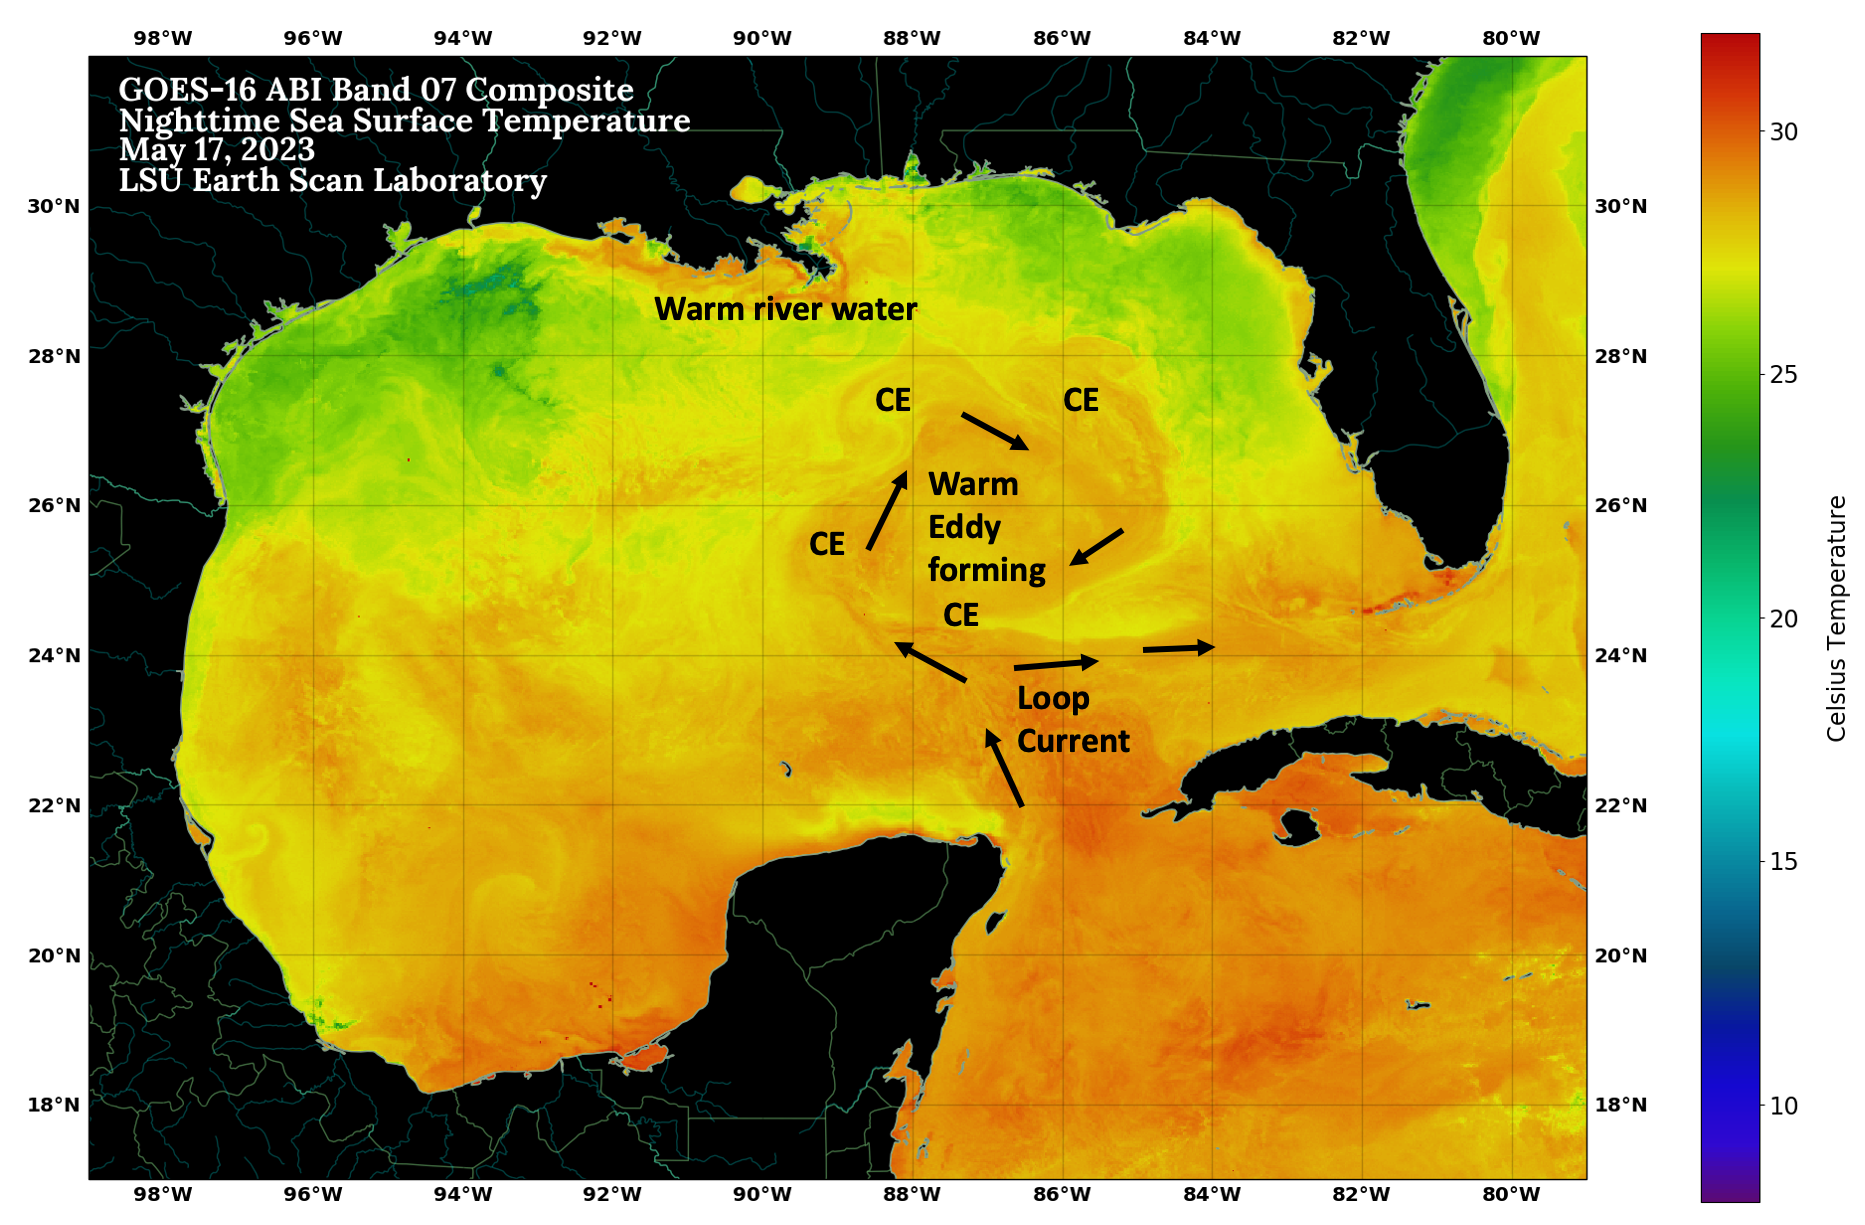
Image of the Week

Image of the Week

Visit our weekly collection to view some of our very best images from each week.

Image of the Week

ABI SST of Loop Current, May 2023

This GOES 16-ABI night-time ST composite from May 17, 2023 (left) shows water temperatures above 29 C (~84 F) along the Louisiana coast due to the rapid warming of a shallow buoyant lens of river water from the Mississippi and Atchafalaya Rivers on the continental shelf. A short animation of May 1-19 is shown at right. Intense solar heating in the absence of strong winds is responsible for these warm coastal waters. In deep water, a large Warm Eddy (also > 29 C) is seen to be forming from the northern portion of the Loop Current due in part to the intensification of cyclonic Cold Eddies (CE) along its margin. In contrast to the shallow layer of warm river water along the coast (~1-5 meters deep), the warm water within the high velocity Loop Current extends to about 100 meters deep, giving it the potential to intensify tropical storms and hurricanes that track over it, depending upon atmospheric conditions.

ABI SST of Loop Current, May 2023 Eddy Zodiac Formation Gulf of Mexico SST, August 16, 2022 June 21 ABI SST Eddy June 14, 2022 Loop Current April 25 GoM SST GOES-16 ABI Gulf of Mexico SST Aqua MODIS truecolor Gulf of Mexico Flood Sediment March 2019 Mar 06 2019 16:31 Landsat 30m Lake Pontchartrain Feb 11 2019 GOES-16 Full DIsk Sep 12 2018  MODIS Hurricane Florence Mar 03 2018 Landsat8 LakePont Dec 09 2017 19:35 MODIS AQUA Snow Sep 06 2017 MODIS 250m Irma Aug 20 2017 GOES GOM Color SST/SSH Mar 14 2017 19:25 MODIS 250m LA Landsat-8-true-color Oct 30 2016 Landsat-8 true color Oct 07 2016 Record Rainfall Event, August 2016 Typhoon Nida Super Typhoon Nepartak May 2016 GOES Monthly North Atlantic SST Anomaly May 04 2016 18:45 MODIS 250m LA Apr 2016 GOES Monthly North Atlantic SST Anomaly Apr 03 2016 19:30 MODIS 250m LA Mar 01 2016 NOAA 7 Day Composite with SSH Feb 26 2016 19:10 MODIS 250m LA Feb 10 2016 19:10 MODIS 250m LA Winter Storm Jonas Snowfall Modis True Color Image Lake Pontchartrain Jan 18 Modis True Color Lake Pontchartrain  Bonnet Carre Spillway Opening Effect Jan 06 2016 18:40 MODIS 250m LA Dec 14 2015 17:00 MODIS 250m LA VIIRS Holiday 2015 MODIS Sediment MODIS Mountain Snow Eddy Olympus GOES Eddy Olympus Hurricane Patricia's Eye Hurricane Olaf MODIS Image Clear Skies Oct 12 2015 19:15 MODIS 250m LA Oct 02 2015 17:05 MODIS 250m ATCH Sep 22 2015 16:30 MODIS 250m LA Sep 13 2015 16:35 MODIS 250m LA Typhoon Kilo Katrina Panel Hurricane Katrina 10 year Landsat8 Image Atchafalaya Sediment Discharge Atchafalaya Basin Sediment Typhoon Chan-Hom Jul 04 2015 07:27 UTC VIIRS GOM M13 Temperature African Dust South America Tropical Storm Bill Mississippi River Plume May 27 2015 07:44 UTC VIIRS GOM M13 Temperature Tropical Disturbance Deepwater Horizon Oil Spill Image Tropical Cyclone Joalane MODIS Sediment Image Mar 27 2015 19:10 MODIS 250m LA David Pond Opening Mar 17 2015 17:00 MODIS 250m MRP Tropical Cyclone Pam African Dust Coast Tropical Cyclone Glenda Cyclone Lam Frozen Lake Erie Mardi Gras 2015 Day Night Band and Thermal viirs_juno Jan 21 2015 08 UTC NOAA-19 MRP SST Tropical Cyclone Bansi African Dust Storm Mexican Upwelling Image 2014 Christmas Image Super Typhoon Hagupit Nov 28 2014 19:01 MODIS 250m LA Cold Air Advection Colorado Dust Storm Nov 02 2014 08 UTC NOAA-19 Atch Bay SST Oct 27 2014 07:43 UTC AVHRR GOM SST Hurricane Gonzalo Visible Eye Hurricane Gonzalo Visible MODIS Post Frontal Passage Tropical Storm Gonzalo Water Vaport Tropical Storm Gonzalo California Smoke Plume Hurricane Edouard Atlantic Hurricane Edouard Hurricane Odile Gulf Disturbance Hurricane Cristobal Tropical Waves Atlantic Arrows Eastern Pacific Hurricanes Iselle and Julio Hurricane Bertha Water Vapor Tropical Storm Bertha Dry Air Yosemite Fires GOES-13 Dry Air African Dust Stable Layer Terra-1: Hurricane Arthur Aqua-1: Tropical Storm Arthur Tropical Storm Arthur African Dust Hurricane Cristina June 12, 2014 SNPP Day/Night June 4 2014 Mexico Fires Sumo-NPP Truecolor May 29, 2014 18:55 UTC May 20 2014 GOES North Atlantic SST VIIRS RGB Comparisons - San Diego Wildfires 2014 SNPP.20140513.0737.NPP May 05 2014 08:01 UTC AVHRR GOM SST Suomi-NPP IR: Gulf Coast April 29, 2014 07:00 UTC Apr 24 2014 NOAA 3 Day Composite Suomi-NPP True Color April 9, 2014 19:31 UTC Mar 2014 GOES Monthly North Atlantic SST Anomaly DNB Composite Northeastern United States Suomi-NPP VIIRS Mid-IR Gulf Stream Mar 04 2014 GOES Gulf SST Mardi Gras Image Lake Superior Image with Ice MODIS Image of Great Lakes Ice Cover Suomi-NPP Swath February 10, 2014 Feb 10 2014 09 UTC NOAA-18 MRP SST MODIS Snow Image 2014 MODIS Image of Winter Storm MODIS Heavy Sediment Annotation NOAA-19 Eddy Image of the Week Jan 12 2014 19:05 MODIS 250m LA AVHRR Cold Front SST Jan 08 2014 19:30 MODIS 250m LA New Year Image 2014 GOES Weekly Composite Christmas Image GOES Infrared December 6 2013 14:45 UTC Nov 27 2013 18:53 MODIS 250m LA Nov 19 2013 GOES North Atlantic SST Nov 12 2013 GOES North Atlantic SST Nov 02 2013 18:59 MODIS 250m LA Happy Halloween! Oct 08 2013 19:05 MODIS 250m LA October 3, 2013: KAREN-2013 Visible over SST Sep 2013 GOES Monthly North Atlantic SST Anomaly NOAA-130909-130923-FRONTAL PASS Tropical Storm Ingrid Sep 03 2013 GOES North Atlantic Storm Conditions Aug 2013 GOES Monthly Gulf of Mexico SST Anomaly Hurricane Katrina - August 28, 2005 Anniversary Fernand MODIS Image of Sediment from Atchafalaya Basin Invest 92L Forecast Models Tropical Storm Erin Forecast Models Aug 06 2013 GOES North Atlantic SST/SSH NOAA-19: Remnants of Tropical Storm Dorian Tropical Storm Dorian's Forecast Track Tropical Depression Dorian Models g13.130716.weekcomp.sst.storm.iotw.jpg Jul 02 2013 GOES North Atlantic SST NOAA-19 Visible Image of Tropical Storm Barry June 5 2013 16:16 Tropical Storm Andrea Truecolor t01.130605.1621.iotw.jpg n16.130514.1524.no_cloudmask.iotw.jpg May 05 2013 17:09 MODIS TC SWATH Apr 30 2013 GOES North Atlantic SST MODIS TRUECOLOR IOTW GOES-13 Weekcomp Gulf Stream Apr 09 2013 GOES North Atlantic SST Apr 02 2013 GOES Gulf SST Mar 27 2013 16:52 MODIS 250m LA Mar 26 2013 GOES North Atlantic SST Mar 24 2013 20 UTC NOAA-18 Atch Bay Reflectance Mar 19 2013 19:23 MODIS 250m LA Mar 12 2013 19:17 MODIS 250m LA Mar 03 2013 19:23 MODIS 250m LA Feb 26 2013 19:04 MODIS 250m LA Feb 16 2013 16:46 MODIS 250m LA Jan 24 2013 16:40 MODIS 250m LA Jan 17 2013 16:34 MODIS 250m LA Dec 22 2012 19:17 MODIS 250m LA Dec 12 2012 16:58 MODIS 250m LA Nov 16 2012 16:21 MODIS 250m LA Oct 28 2012 19:10 MODIS 250m LA Sep 10 2012 19:10 MODIS 250m LA Sep 07 2012 17:05 MODIS 250m LA Sep 06 2012 19:31 MODIS 250m LA Jul 16 2012 16:40 MODIS 250m LA Jul 01 2012 GOES El Nino SST Color Jun 04 2012 UTC Atlantic Basin SST May 17 2012 16:15 MODIS 250m LA Apr 09 2012 16:52 MODIS 250m LA Mar 24 2012 17:00 MODIS 250m ATCH Feb 29 2012 GOES GOM Color SST/SSH Feb 08 2012 19:00 MODIS 250m LA Jan 28 2012 19:18 MODIS 250m LA Dec 22 2011 GOES GOM Color SST Dec 01 2011 17:06 MODIS 250m LA Nov 17 2011 17:00 MODIS 250m LA Oct 15 2011 19:24 MODIS 250m LA Sep 27 2011 16:24 MODIS TC SWATH Sep 13 2011 GOES North Atlantic SST Aug 30 2011 19:12 MODIS 250m MRP Aug 15 2011 16:45 MODIS 250m LA Jul 30 2011 16:45 MODIS 250m LA Jul 21 2011 GOES Color N. GOM SST Jul 05 2011 16:55 MODIS 250m MRP Jun 29 2011 19:00 MODIS 250m LA May 28 2011 19:00 MODIS 250m PONTCH May 18 2011 16:48 MODIS 250m LA May 11 2011 16:42 MODIS 250m MRP Feb 11 2011 16:48 MODIS 250m LA Jan 27 2011 19:07 MODIS 250m ATCH Dec 28 2010 GOES North Atlantic SST Oct 14 2010 19:13 MODIS 250m ATCH Sep 08 2010 16:24 MODIS 250m LA Aug 01 2010 17:01 MODIS 250m LA Jul 29 2010 16:30 MODIS 250m LA June 27, 2010 23:52 SST/SAR of the DWH May 20, 2010 11:56 SST/SAR of the DWH May 12, 2010 15:55 SST/SAR of the DWH Apr 25 2010 18:50 MODIS 250m MRP Apr 21 2010 16:00 MODIS 250m MRP Mar 06 2010 19:02 MODIS 250m LA Aug 25 2009 GOES North Atlantic Storm Conditions Jul 07 2009 GOES North Atlantic Storm Conditions Jun 30 2009 GOES North Atlantic Storm Conditions Jun 23 2009 GOES North Atlantic Storm Conditions Jun 16 2009 GOES North Atlantic Storm Conditions Jun 09 2009 GOES North Atlantic Storm Conditions May 12 2009 GOES North Atlantic Storm Conditions Mar 02 2009 18 UTC NOAA-18 MRP SST Feb 06 2009 19:11 MODIS 250m LA Jan 07 2009 18:58 MODIS 250m LA MODIS TRUECOLOR SNOW IMAGE OF THE WEEK Nov 26 2008 11:17 UTC AVHRR GOM SST Oct 20 2008 16:24 MODIS 250m LA Hurricane Ike May 25 2008 16:49 MODIS 250m MRP Jan 01 2008 18:01 UTC OCM ATCH Truecolor Jan 01 2008 18:01 UTC OCM MRP Truecolor Aug 28 2007 GOES North Atlantic SST Jul 17 2007 18:01 UTC OCM LA Truecolor Jul 11 2007 19:06 MODIS 250m LA Jul 01 2007 18:01 UTC OCM Extended GOM Chlorophyll Jun 26 2007 GOES North Atlantic SST/SSH Jun 03 2007 18:01 UTC OCM GOM Chlorophyll May 25 2007 16:36 MODIS 250m ATCH May 18 2007 18:01 UTC OCM GOM Truecolor May 08 2007 19:06 MODIS 250m LA Apr 26 2007 18:01 UTC OCM GOM Chlorophyll Apr 10 2007 GOES North Atlantic SST/SSH Mar 31 2007 16:23 UTC AVHRR Swath Mar 05 2007 19:07 MODIS 250m LA Feb 28 2007 04 UTC NOAA-17 MRP SST Feb 06 2007 GOES North Atlantic SST Jan 29 2007 04 UTC NOAA-17 MRP SST Jan 02 2007 GOES North Atlantic SST Dec 02 2006 16:23 MODIS 250m LA Nov 25 2006 GOES GOM Color SST/SSH Nov 14 2006 GOES North Atlantic SST Oct 24 2006 18:01 UTC OCM GOM Chlorophyll Oct 03 2006 GOES North Atlantic Storm Conditions Sep 26 2006 19:06 MODIS 250m LA Sep 16 2006 18:01 UTC OCM GOM Chlorophyll Aug 16 2006 19:12 MODIS 250m LA Jul 11 2006 GOES North Atlantic Storm Conditions Jun 20 2006 GOES North Atlantic SST Jun 08 2006 18:03 UTC OCM GOM Chlorophyll May 23 2006 18:52 MODIS 250m LA May 17 2006 07:32 UTC AVHRR Swath Apr 09 2006 18:03 UTC OCM GOM Truecolor Apr 01 2006 18:03 UTC OCM GOM Chlorophyll Aug 10 2005 18:03 UTC OCM LA Truecolor Aug 09 2005 GOES North Atlantic SST Jun 14 2005 GOES GOM Color SST/SSH May 25 2005 04:04 UTC AVHRR GOM SST Apr 28 2005 18:03 UTC OCM GOM Chlorophyll Apr 05 2005 GOES North Atlantic SST Hurricane Ivan Hurricane Lili Hurricane Andrew Track Hurricane Andrew Swath

Galleries

See our gallery collections for various events and topics of interest

Our Best Image Galleries


Ocean Animations

See our best animations of the ocean in motion.

animations/best_of_esl/ocean_animations/zap.gif
Eddy Zap, animated gif
animations/best_of_esl/ocean_animations/mw.epacloop5.gif
Microwave SST, East Pacific, 2014
animations/best_of_esl/ocean_animations/ivan-cw-sst-12fps.mov
2004 GOES SST Ivan Cool Wake
animations/best_of_esl/ocean_animations/bill.goes.august.2009.mov
Hurricane Bill Passes Through the Atlantic
animations/best_of_esl/ocean_animations/ike.coolwake.mov
Hurricane Ike Cool Wake in the GOM
animations/best_of_esl/ocean_animations/goes.1998.2010.std.mov
GOES Monthly Composite SST Animation, 1998-2010
animations/best_of_esl/ocean_animations/2005_hurricanes_animation.gif
2005 Hurricane Season Microwave SST Cool Wakes
animations/best_of_esl/ocean_animations/SSH_1993to2006.mov
SSH Loop Current Circulation by Robert Leben
animations/best_of_esl/ocean_animations/gustav.coolwake.mov
Hurricane Gustav Cool Wake in the GOM
research/animations/comploop3.gif
1999 Loop Current Sheds an Eddy
animations/best_of_esl/ocean_animations/goes.1998.2010.12year.anom.mov
GOES 12-year Anomaly Calculation, 1998-2010
animations/best_of_esl/ocean_animations/Gulf_GOES_fhd.mov
GOES SST and drifter motion: April 2001-Nov 2004
animations/best_of_esl/ocean_animations/20013daycomp.clranim.gif
GOES SST and Currents at 26N 92W March-April 2001

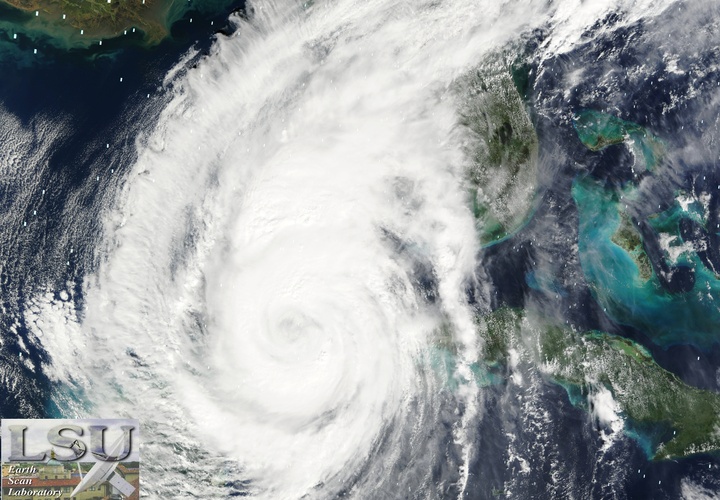
Atmospheric Animations

See our best animations of the atmoshpere and tropical systems.

animations/best_of_esl/hurricane_animations/Katrina-Aug28.gif
Hurricane Katrina's approach to the Gulf Coast
animations/best_of_esl/hurricane_animations/Ivan-GOM-loop.gif
Hurricane Ivan GOES Water Vapor
animations/best_of_esl/hurricane_animations/ISIDORE.gif
Hurricane Isidore GOES Water Vapor
animations/best_of_esl/hurricane_animations/Edouard_ir.mov
Hurricane Edouard GOES IR Quicktime
animations/best_of_esl/hurricane_animations/Rita_wv_loop.red.gif
Hurricane Rita GOES Water Vapor
animations/best_of_esl/hurricane_animations/Harvey_2017.mp4
Hurricane Harvey 2017
animations/best_of_esl/hurricane_animations/georges.animate.gif
Hurricane Georges GOES Infrared
animations/best_of_esl/hurricane_animations/Katrina-eye-closeup.gif
Hurricane Katrina's Eye
animations/best_of_esl/hurricane_animations/GHIanim_1280x720.mov
Hurricanes Gustav, Hanna, and Ike GOES WV
animations/best_of_esl/hurricane_animations/edouard.ir.gif
Hurricane Edouard GOES IR animated gif
animations/best_of_esl/hurricane_animations/Katrina_ch3_anim.gif
Hurricane Katrina GOES Water Vapor
animations/best_of_esl/hurricane_animations/Isabel.cl.anim.gif
Hurricane Isabel GOES Water Vapor
animations/best_of_esl/hurricane_animations/Maria_2017.mp4
Hurricane Maria 2017
animations/best_of_esl/hurricane_animations/GHIanimCH4bd5_1280x720.mov
Hurricanes Gustav, Hanna, and Ike GOES IR
animations/hurricanes/2010/alex_2010_wv_web/alex_2010_wv_web-desktop.m4v
Hurricane Alex Water Vapor Animation
animations/hurricanes/2005/wilma_2005_wv/wilma_2005_wv-desktop.m4v
Hurricane Wilma Water Vapor Animation

Loop Current and
Frontal Eddies

The loop current and its frontal eddies greatly impact currents throughout the Gulf of Mexico. See more on these important processes here.

Studying the Loop Current at the ESL

LCFE Image

The Gulf of Mexico Loop Current is one of the most dynamic ocean currents in the world. Walker and staff have developed specialized image processing techniques that provide better and more frequent SST retrievals in the Gulf to monitor these currents. Gulf currents are known to impact hurricanes.
 
The Loop Current and the warm-core eddies that separate from it are large reservoirs of heat that have the capability to intensify hurricanes and tropical storms crossing the Gulf. Conversely, Walker’s research has shown that cold-core eddies, which are regions of vigorous upwelling become energized by hurricane winds. In extreme cases, the cold water that is rapidly upwelled from ~60 m depth can immediately weaken hurricanes by cutting off their energy before landfall. During the Deepwater Horizon oil spill, our SST tracking capabilities led to the discovery of eddy merging along the Loop Current margin, an event that significantly changed oil spill motion. 

In the summer months the loop current and its associated eddies can be difficult to detect by inspecting surface temperatures alone.

GoM SST/SSH

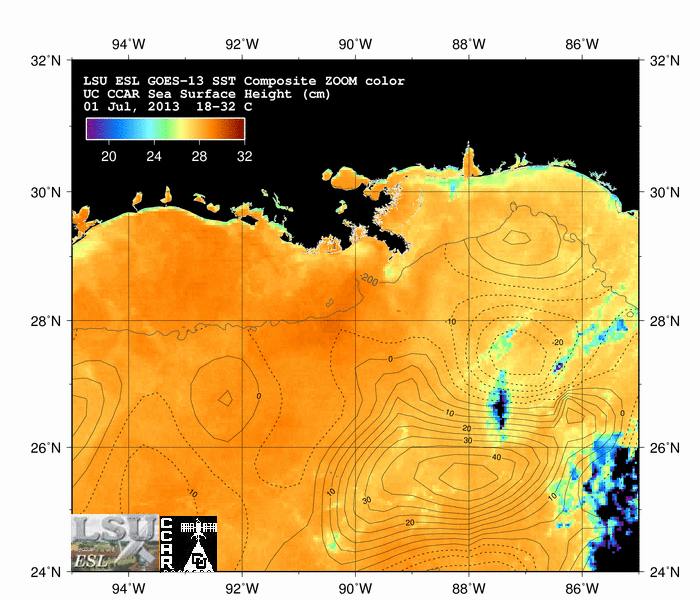
A warm core eddy below a cool cyclone during the summer of 2013
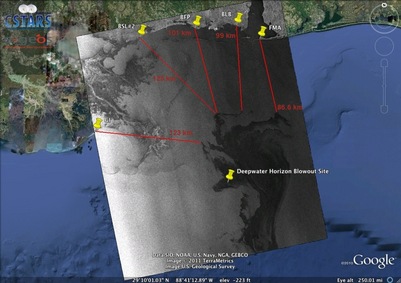
For this reason additional datasets must be studied in order to determine the location of currents within the Gulf of Mexico. One satellite-based dataset used in this effort are altimeter readings of sea surface heights. The loop current and other clockwise-rotating eddies have a high sea height signature, while counter-clockwise rotating eddies have a low sea height signature. While satellite-derived sea surface temperature data capture information throughout the entire Gulf of Mexico each time a satellite pass is recorded, sea surface heights are recorded only directly below the satellite's nadir. These samples are then interpolated across the entire Gulf of Mexico in order to provide a useful view of sea height conditions. Gathering two dimensional data from one dimensional data samples in this way affects the precision of the of height measurements in areas of the dataset where altimeter sampling is sparse. This means that fast changing ocean processes may be lost in areas of infrequent altimeter sampling. Combining SSH with SST data therefore yeilds a superiour product than either in isolation. To the right you'll see some animations showing altimeter readings taken over the Gulf of Mexico during the course of a day for the time periods indicated. Be sure to visit our GVAR archives to see imagery of ocean currents in the Gulf of Mexico and Atlantic basin.


Deepwater Horizon

Learn more about our imagery of surface oil as well as research conducted with this data.

Deepwater Horizon Surface Oil

On April 20, 2010 the Deepwater Horizon (DWH) oil rig experienced a series of malfunctions and subsequent explosions that disengaged the rig from its drill and killed eleven workers onboard. The explosion damaged the wellhead 5,000 feet below the surface, and crude oil flowed from the damaged wellhead until a containment cap was put in place on July 15, 2010.

The Earth Scan Laboratory has been tracking the oil that reaches the surface of the Gulf of Mexico (GOM). The image to the right is a composite of three satellite images all captured around June 14, 2010: calculated sea surface temperatures captured by the MODIS sensor aboard NASA's Aqua-1 satellite with microwave imagery from Radarsat-1 and Envisat superimposed. See links below for surveillance of this environmental crisis.

MODIS image of the Deepwater Horizon oil slick in the northern Gulf of Mexico