
Hurricane Katrina 2005
Tracking Information from the NHC
NHC Advisory : 31Name : KATRINA
Type : Dissipated
Position : 36.3 N 87.5 W
Heading (degrees) : 30
Motion Speed (kts) : 18
Central Pressure (mb) : 985.0
Maximum Sustained Winds (kts) : 30.0
Maximum Wind Gusts (kts) : 40.0
Valid time : August 30, 2005, 00:00 UTC
Note: To convert wind speeds to MPH, multiply knots by 1.15 (i.e. add 15%)
| Date | Latitude | Longitude | Pressure | Max Winds | Max Gust |
|---|---|---|---|---|---|
| YYMMDD HH | Deg N | Deg W | mbar | kts | kts |
| 050824 02 | 23.2 | -75.5 | 1007.0 | 30.0 | 40.0 |
| 050824 08 | 23.4 | -76.0 | 1007.0 | 30.0 | 40.0 |
| 050824 14 | 24.0 | -76.4 | 1006.0 | 30.0 | 40.0 |
| 050824 20 | 24.7 | -76.7 | 1006.0 | 35.0 | 45.0 |
| 050825 02 | 25.6 | -77.2 | 1002.0 | 40.0 | 50.0 |
| 050825 08 | 26.0 | -78.0 | 1001.0 | 45.0 | 55.0 |
| 050825 14 | 26.2 | -78.7 | 1000.0 | 45.0 | 55.0 |
| 050825 20 | 26.2 | -79.3 | 997.0 | 50.0 | 60.0 |
| 050826 02 | 26.1 | -79.9 | 985.0 | 65.0 | 80.0 |
| 050826 08 | 25.5 | -80.7 | 984.0 | 65.0 | 80.0 |
| 050826 14 | 25.3 | -81.5 | 987.0 | 65.0 | 80.0 |
| 050826 20 | 25.1 | -82.2 | 981.0 | 70.0 | 85.0 |
| 050826 20 | 25.1 | -82.2 | 971.0 | 85.0 | 105.0 |
| 050827 02 | 24.8 | -82.9 | 965.0 | 85.0 | 105.0 |
| 050827 08 | 24.6 | -83.6 | 965.0 | 90.0 | 110.0 |
| 050827 14 | 24.4 | -84.4 | 945.0 | 100.0 | 120.0 |
| 050827 20 | 24.5 | -85.0 | 940.0 | 100.0 | 120.0 |
| 050828 02 | 24.6 | -85.6 | 945.0 | 100.0 | 120.0 |
| 050828 08 | 25.0 | -86.2 | 939.0 | 100.0 | 120.0 |
| 050828 08 | 25.0 | -86.2 | 939.0 | 100.0 | 120.0 |
| 050828 11 | 25.1 | -86.8 | 935.0 | 125.0 | 150.0 |
| 050828 14 | 25.4 | -87.4 | 935.0 | 125.0 | 155.0 |
| 050828 17 | 25.7 | -87.7 | 908.0 | 140.0 | 170.0 |
| 050828 20 | 26.0 | -88.1 | 907.0 | 150.0 | 185.0 |
| 050829 02 | 26.9 | -89.0 | 902.0 | 145.0 | 175.0 |
| 050829 08 | 27.6 | -89.4 | 904.0 | 140.0 | 170.0 |
| 050829 14 | 28.8 | -89.6 | 915.0 | 130.0 | 160.0 |
| 050829 20 | 30.2 | -89.6 | 927.0 | 110.0 | 135.0 |
| 050830 02 | 31.9 | -89.6 | 960.0 | 65.0 | 80.0 |
| 050830 08 | 33.5 | -88.5 | 973.0 | 50.0 | 60.0 |
| 050830 14 | 34.7 | -88.4 | 981.0 | 45.0 | 55.0 |
| 050830 20 | 36.3 | -87.5 | 985.0 | 30.0 | 40.0 |
Forecast Advisories
Public Advisories
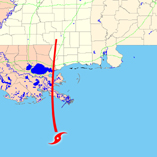
NHC Forecast Track Plot

Satellite Images

Aug. 28, 2005, midnight

Aug. 28, 2005, 5 p.m.

Aug. 29, 2005, 7:15 p.m.

Aug. 31, 2005, midnight
Below you'll find high resolution imagery of flooding in New Orleans as well as land-change analysis of the marshes southeast of New Orleans as a result of Hurricane Katrina
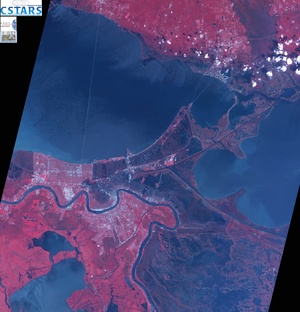 New Orleans and southeast Louisiana September 4, 2005.
Dark regions indicate flooding.
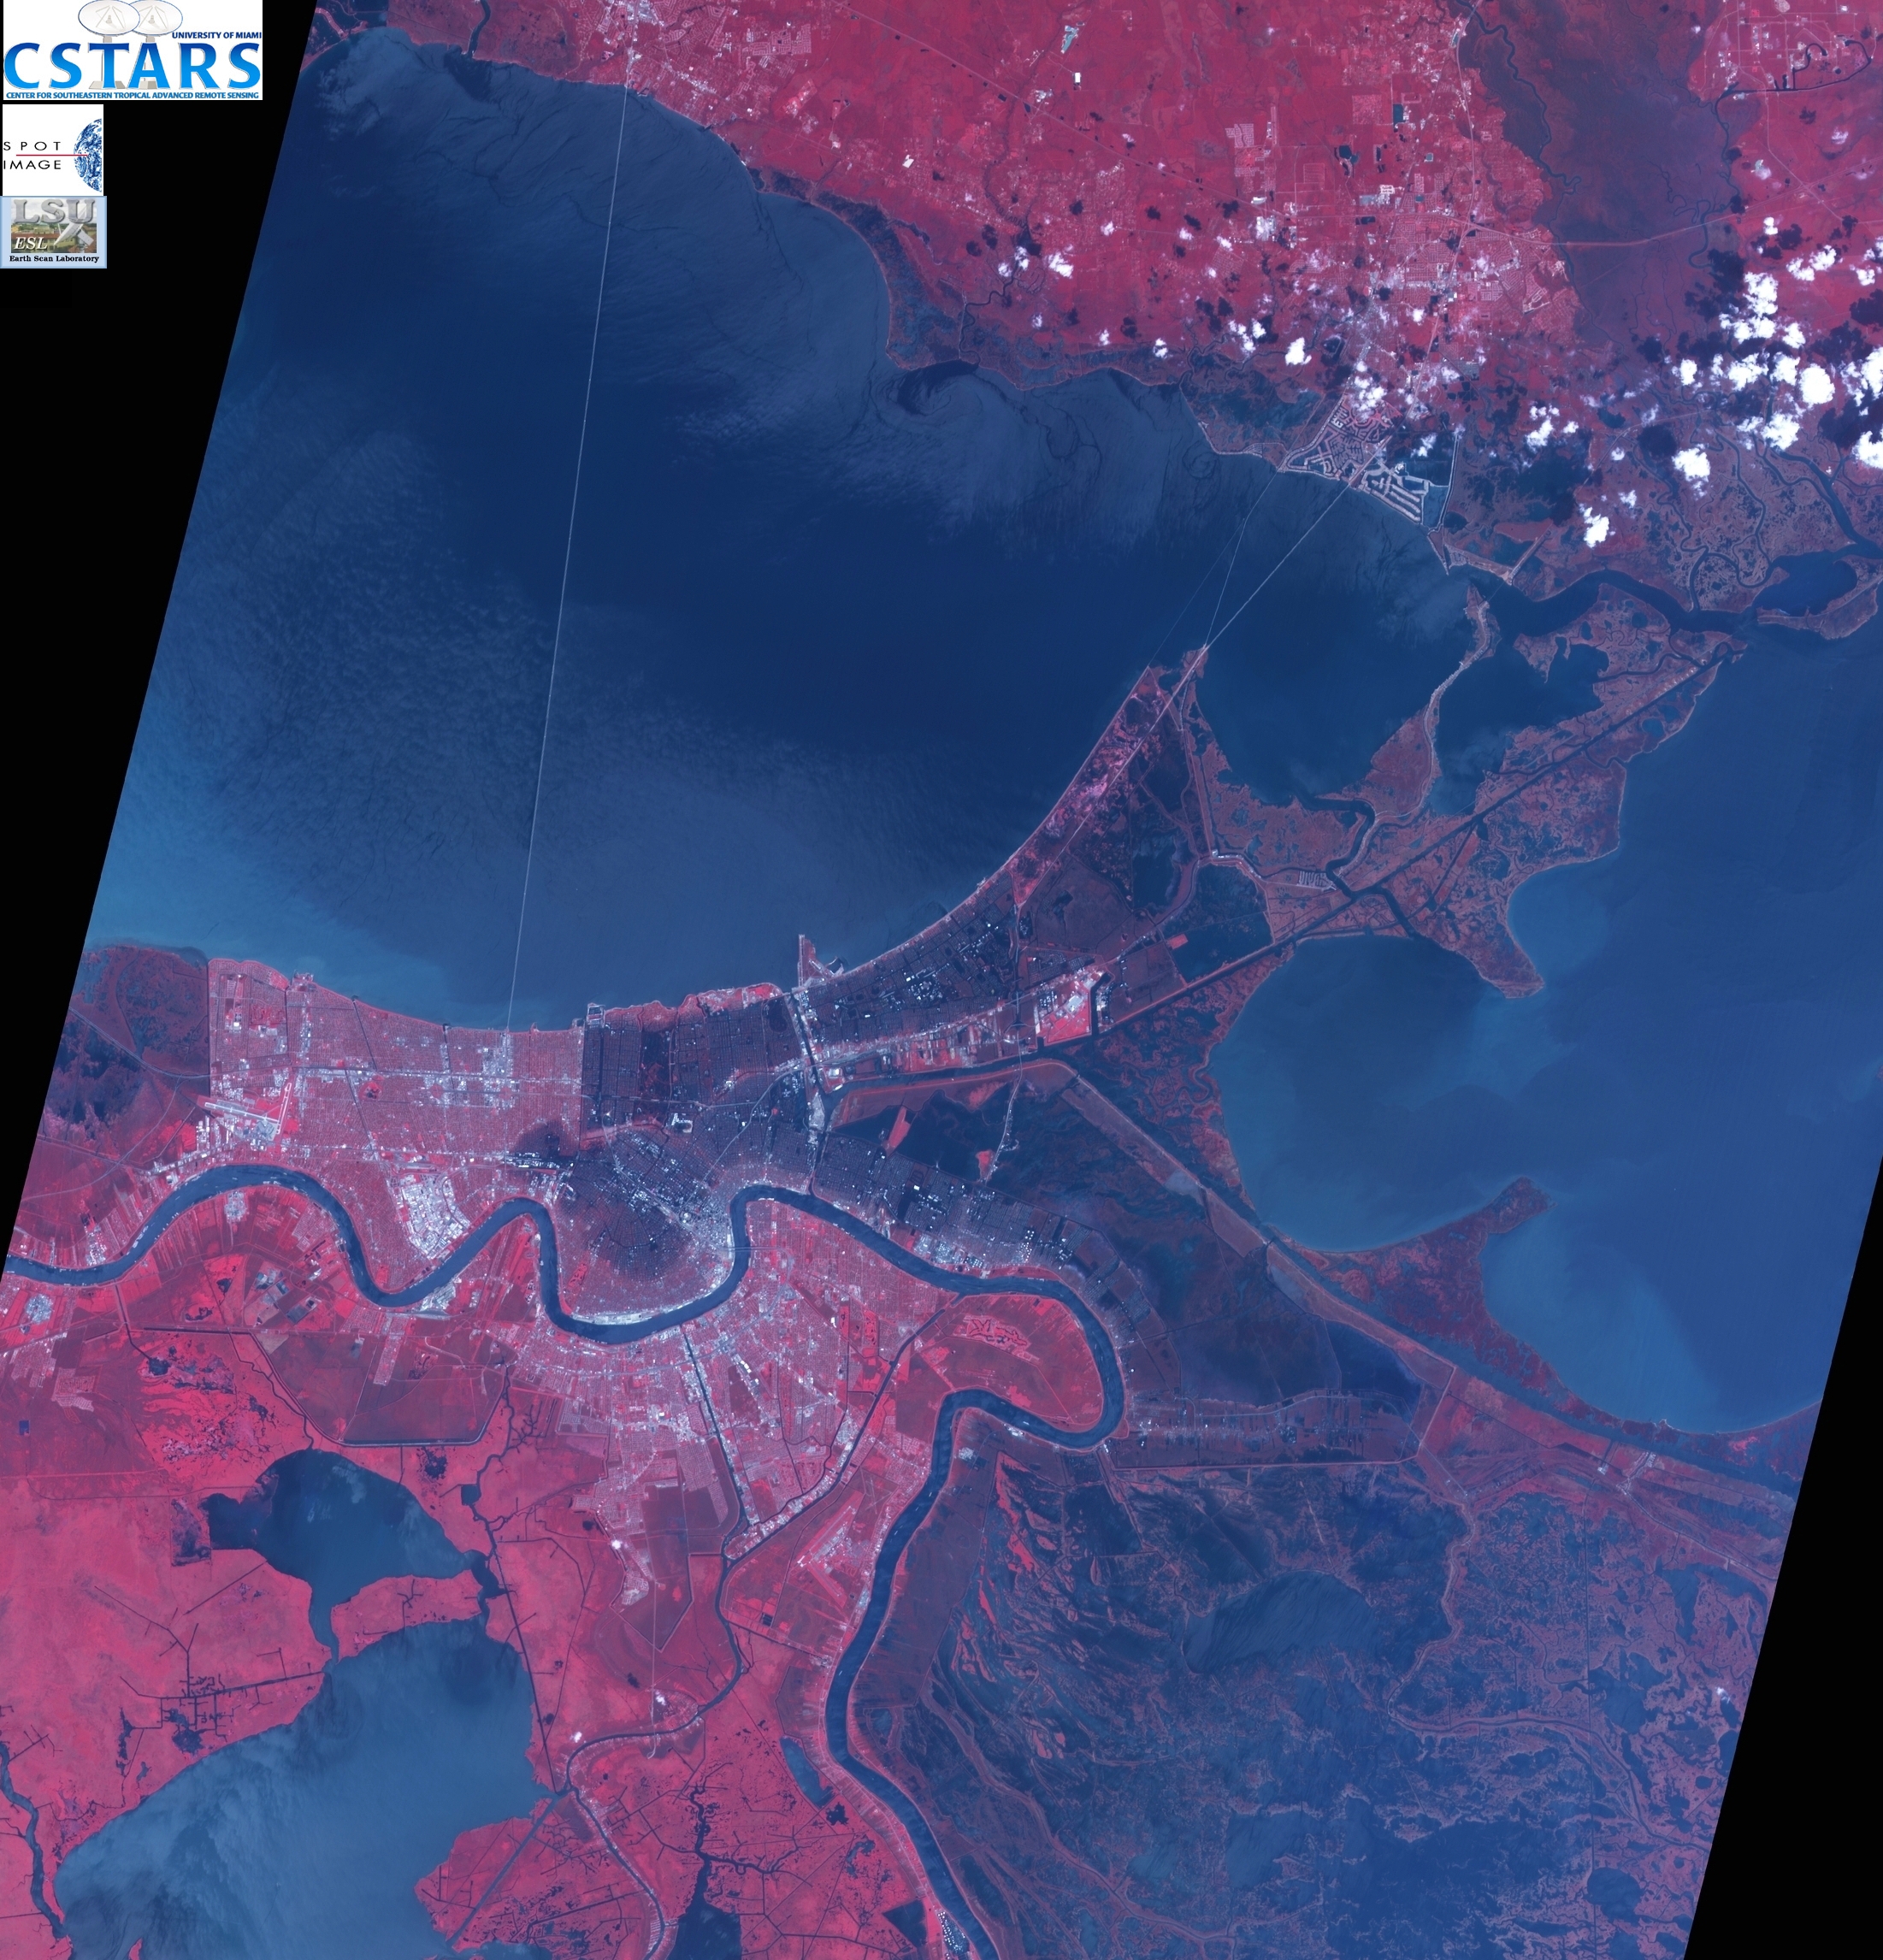
New Orleans and southeast Louisiana September 4, 2005.
Dark regions indicate flooding.
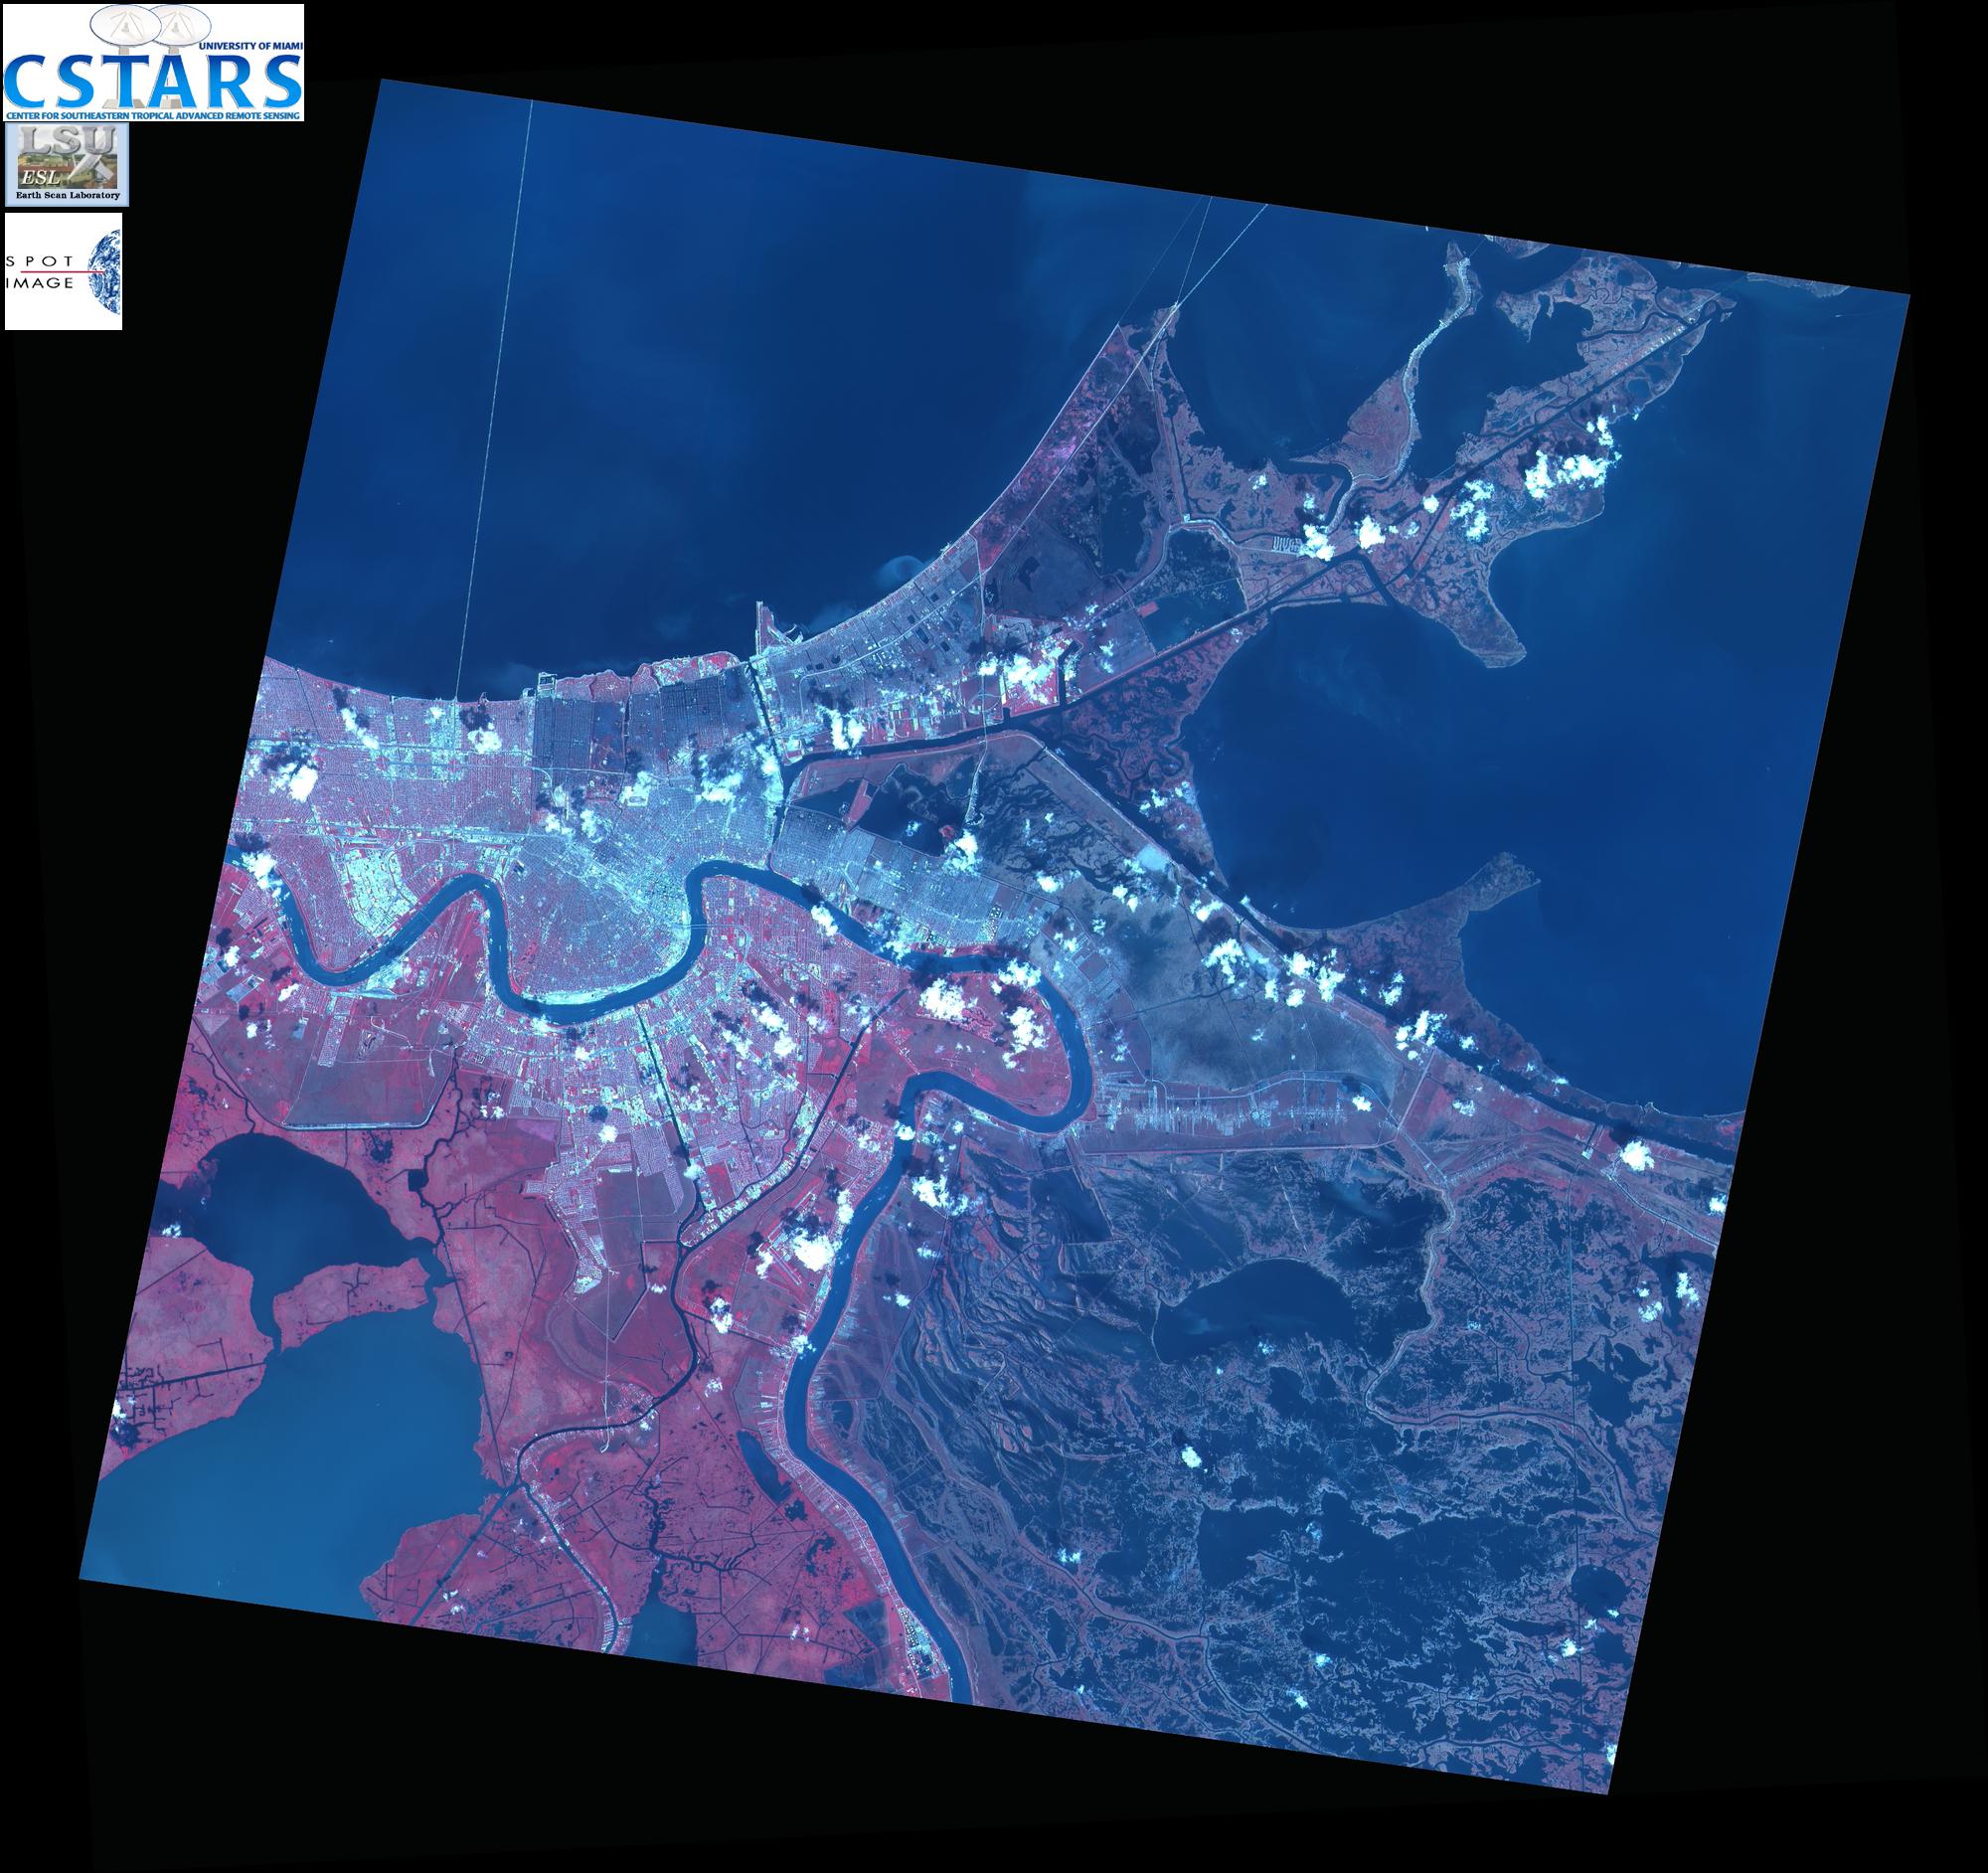
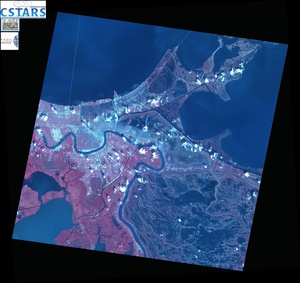 New Orleans and southeast Louisiana September 14, 2005.
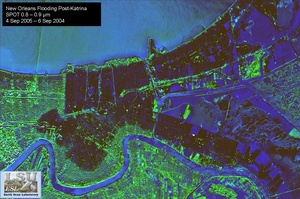 Post-Katrina flooding revealed by comparing near infrared
reflectances on Sep 6, 2004 (not flooded) and Sep 4, 2005 (flooded).
Darker colors indicate flooded areas.
Post-Katrina flooding revealed by comparing near infrared
reflectances on Sep 6, 2004 (not flooded) and Sep 4, 2005 (flooded).
Darker colors indicate flooded areas.
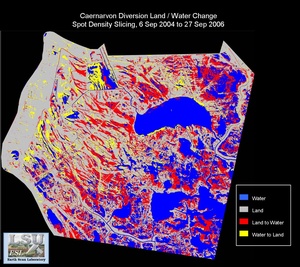 Geographical changes in the marshes due to Hurricane Katrina.
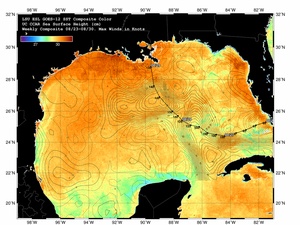 Loop current and warm core rings that assisted in intensifying Katrina as she passed through the Gulf of Mexico.
Very high resolution, airplane-borne photographic archive of the areas affected by Hurricane Katrina.
SPOT Imagery

Land Change Analysis

Pre-storm Analysis

Aerial Photogrammetry (NOAA)

Very high resolution, airplane-borne photographic archive of the areas affected by Hurricane Katrina.
